Notes from the Field: MOW Australia Measures Blue Carbon in Australia
Review. Model. Map. Those are the stages that Mapping Ocean Wealth uses to build an understanding of various ecosystem services. In the review phase, scientists conduct a detailed and systematic exploration of field data, expert literature and knowledge to fully understand and accurately describe the value of an ecosystem service. In the absence of complete sources of data to review, our scientists take to the field to collect data themselves.
The Mapping Ocean Wealth (MOW) team in Australia is focused on collecting data to highlight the many ecosystem services provided by coastal wetlands. Habitats such as saltmarshes, mangrove forests, and seagrass meadows, are a focal point of MOW Australia’s research. These habitats are extreme ecosystems: living at the interface of land and sea, salt and freshwater environments, and are critical to the health and wellbeing of our estuaries. MOW Australia’s is taking an in-depth look at four ecosystem services (coastal-protection, tourism and recreation, carbon-storage and fisheries), carbon-storage recognizes that wetlands are a major sink for carbon dioxide from the atmosphere. The term blue carbon, differentiates these areas from terrestrial forests by referring to the direct influence of the ocean, and marine nature of these carbon storing ecosystems.
Lying across the land and marine interface, saltmarshes, mangroves, and seagrasses trap organic matter and capture carbon at rates of up to 50 times faster compared to terrestrial forests. Thus, maintaining this ecosystem service has profound implications for reducing harmful greenhouse gases in the atmosphere. Appreciating the distribution and value of blue-carbon stored within our estuaries enables us to consider the risk of losing these ecosystems to degradation or replaced with grey infrastructure. However, measuring blue carbon across multiple habitats and geographies can present a challenge. The MOW Australia team’s 2017 field work season is focused on addressing that challenge by asking two major questions.
Question 1: How do blue carbon stocks and sequestration vary across ecosystems and geographies?
Saltmarshes, mangroves, and seagrasses are all major sinks of blue carbon, but the overall carbon storage and sequestration potential can vary greatly both within ecosystems and across ecosystem types. The MOW Australia team is currently collecting soil and biomass samples from saltmarshes, mangroves, and seagrasses in the Richmond River in the state of New South Wales, and Port Phillip Bay and Western Port in the state of Victoria, measuring blue carbon stock variability among different ecosystem types and geographies.
Question 2: How does mangrove rehabilitation increase the amount of blue carbon stored?
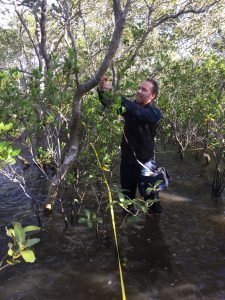
The team has recently been sampling mangrove rehabilitation sites, remnant mangroves and areas where mangroves once used to occur. The aim of this project is to measure and model how the sediment and plant biomass carbon changes with time since rehabilitation. The MOW Australia team are using unmanned aerial vehicles (you may know them as drones) that will be used to create 3D models over much larger areas than could be sampled on the ground, and allows the team to develop ways to estimate mangrove biomass over greater areas.
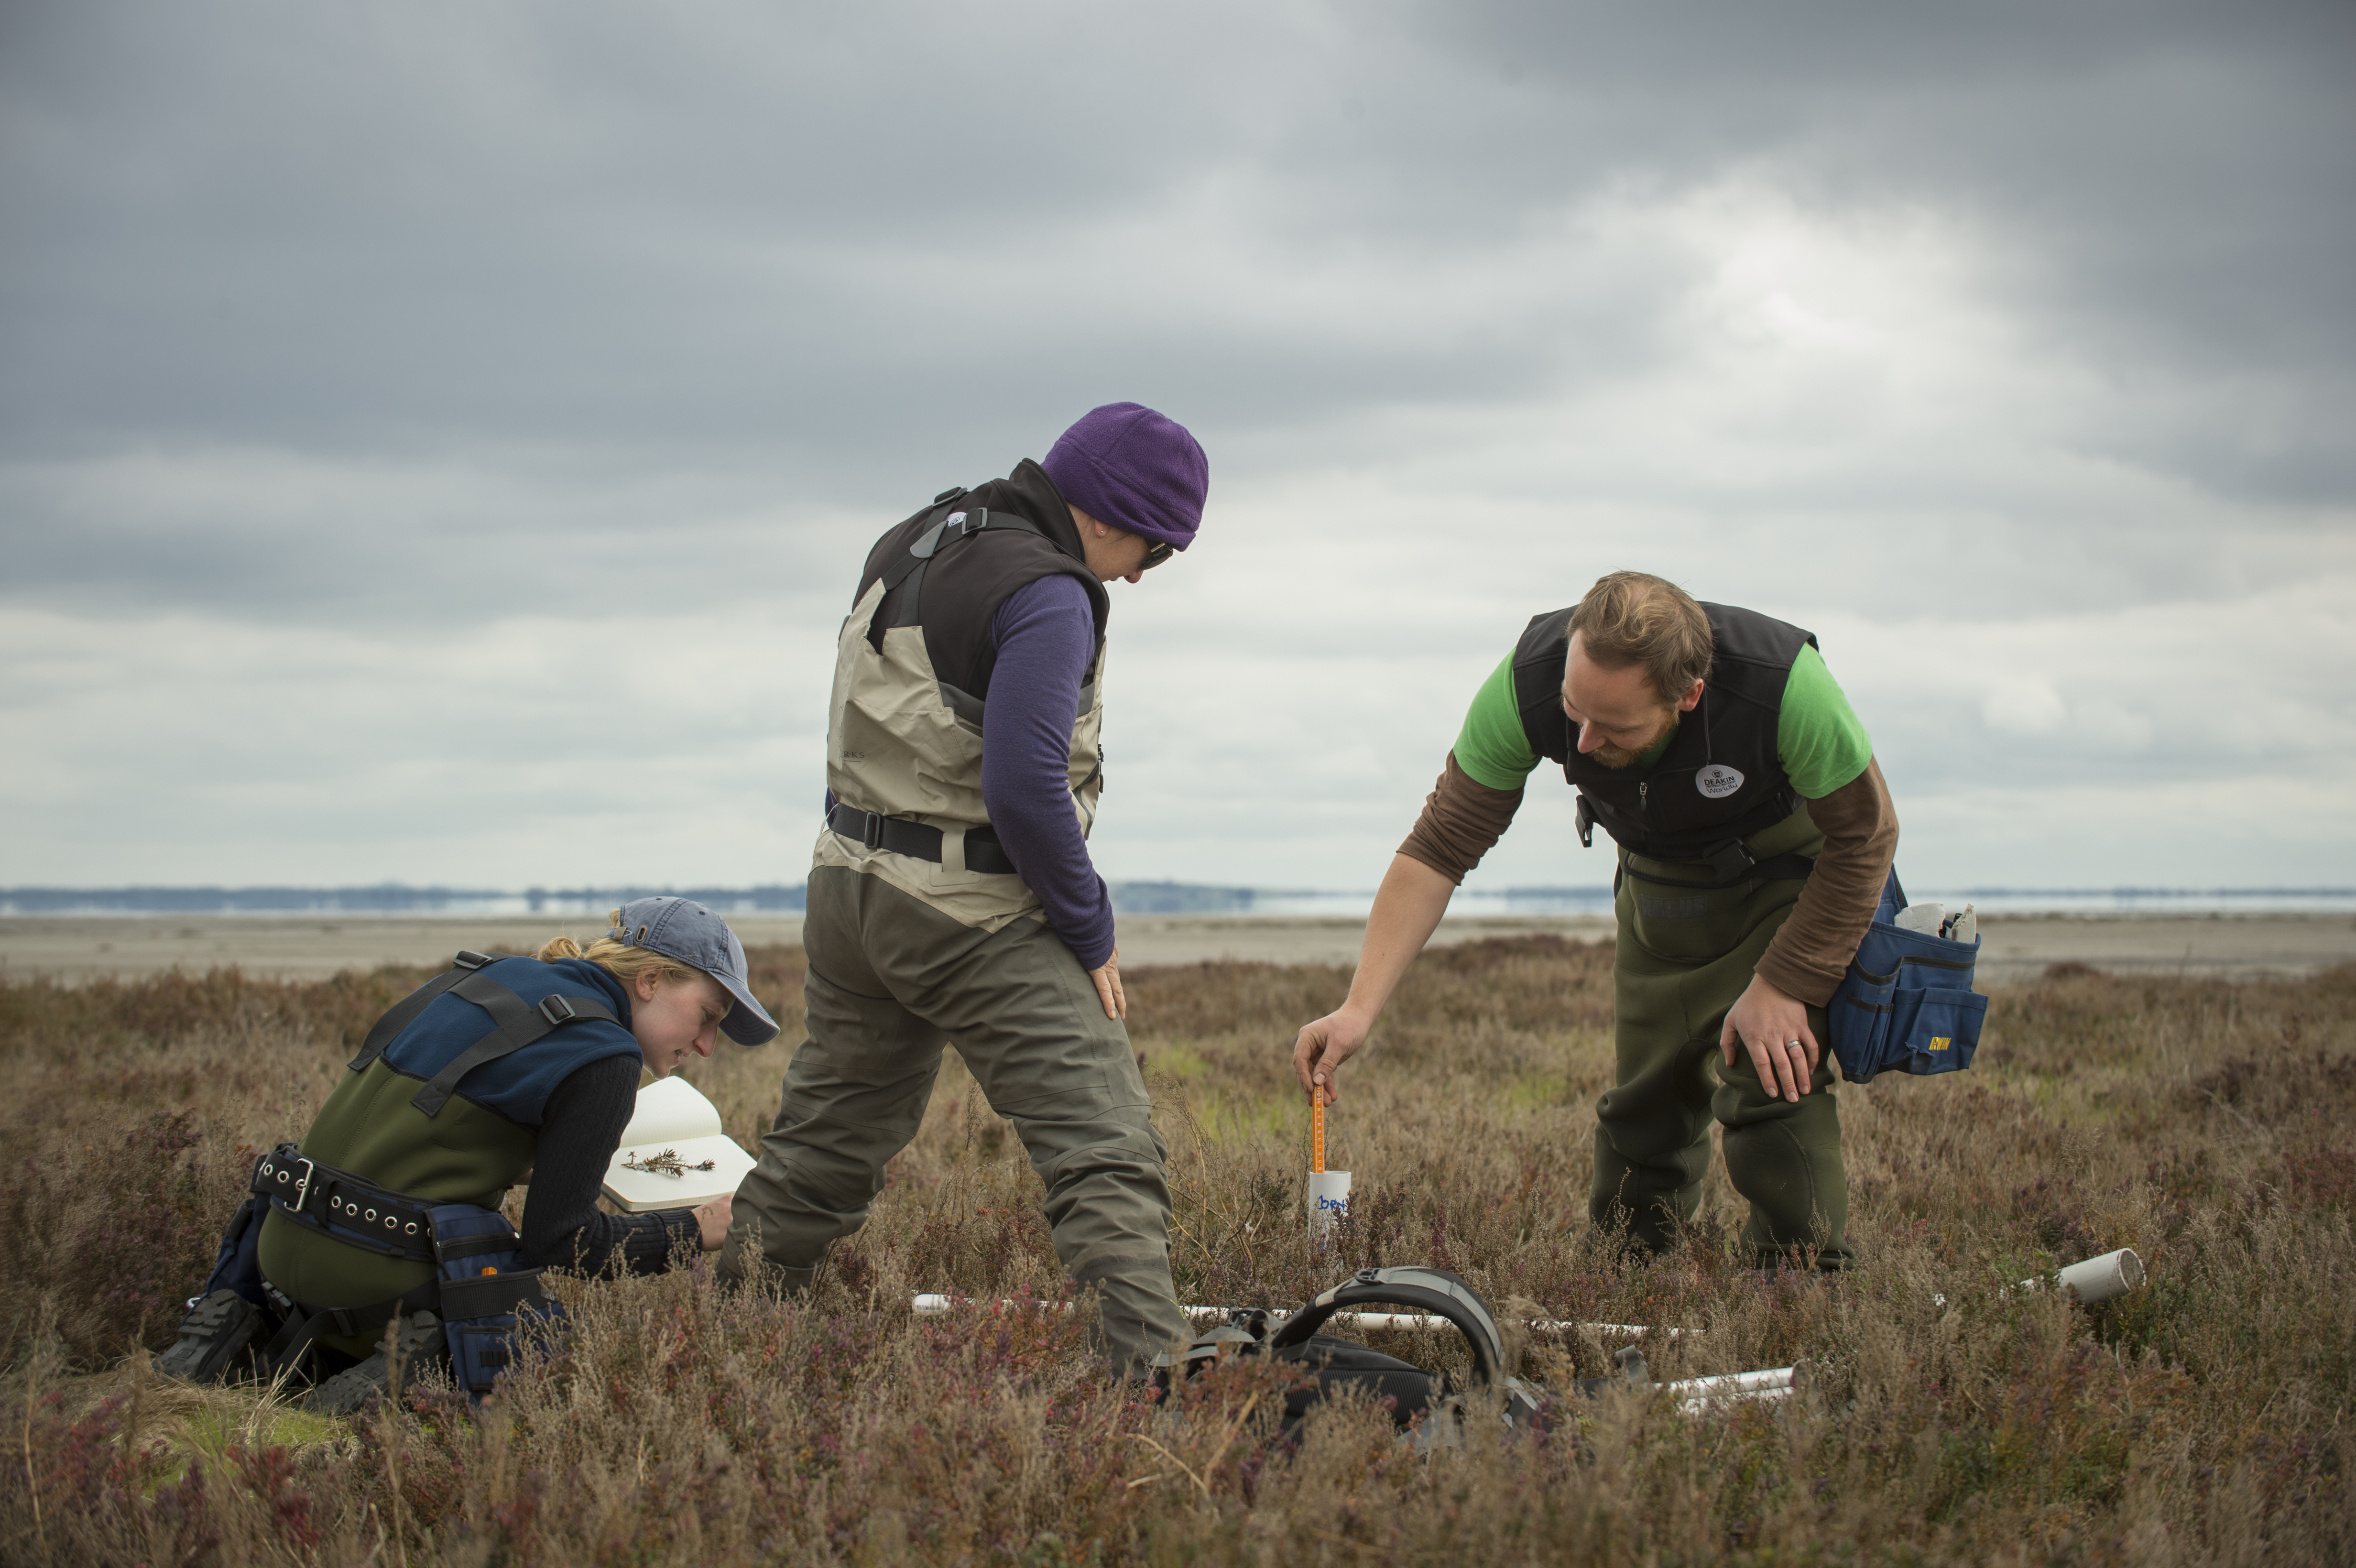
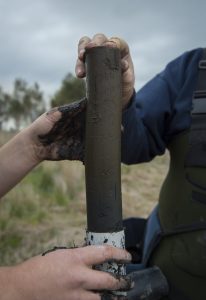
To measure variation in blue carbon stocks among coastal ecosystems, the team collects sediment core samples and takes vegetation measurements from saltmarsh, mangroves, and seagrasses at each site. Scientists can use sediment core samples to measure blue carbon sediment stocks, as well as the age of the sediment, which is used to calculate the rate of carbon sequestration. Vegetation measurements can be used to estimate how much carbon is stored in the form of biomass – leaves, stems and roots. By comparing these samples to samples taken in nearby, non-wetland areas, they can calculate the carbon storage and sequestration potential of each ecosystem type.
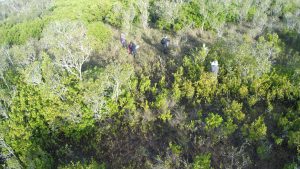
To complement data collected in the field, and to explore techniques for measuring blue carbon over larger areas, the MOW Australia team utilize drones to fly over wetland areas, capturing images which allow the team to estimate mangrove and saltmarsh biomass, and by extension, blue carbon, over larger regions. By pairing these data with historical satellite-derived imagery, the team hopes to create a time-series which shows the spatial and temporal variability of blue carbon distribution over the past 30 years.
Collecting robust data from the field is the first step in modelling and mapping the quantities and distribution of blue carbon stocks in Australia. Once these data are collected, they can be integrated into statistical models which help answer questions about how and why blue carbon stocks vary across ecosystems and geographies, and that knowledge can be expanded to other areas within and beyond Australia. Finally, these data can be mapped, providing a robust visual reference to further conservation goals and inform wetland management decision-making.
Photo credits: Simon Reeves