New Recreational Fishing Maps on MOW!
Recreational fishing in coastal and offshore waters is a globally distributed, high-value activity with numerous benefits such as health, wellbeing, jobs, income, travel, accommodation, and conservation. There are an estimated 220 million recreational fishers in the world, greatly outnumbering commercial fishers in many countries. Even so, recreational fishing’s contribution to total catches is small compared to commercial fish catches, with marine recreational catch estimated at 900,000 tonnes in 2014. Despite lower overall catches at global scales, unsustainable practices in recreational fishing can have impacts on ecosystems and social and economic benefits. It is therefore critical to understand and communicate the value of such fisheries, as a means to support enhanced management and to generate ongoing benefits for fishers, ecosystems and coastal communities.
The value of recreational fishing can be measured in various ways, including monetary values and community welfare metrics like job creation. Australia’s recreational fisheries contribute AUS$11 billion annually to the national economy and support 100,000 jobs. In Southeast Florida, recreational fishing on coral reefs generates 3,787 jobs and an annual economic output of $384 million.
Despite these studies, the systematic quantification and mapping of the social economic values remains rare. Understanding the value and human dependence on recreational fishing can support planning and enable it to be managed alongside other marine activities. Maps showing the spatial distribution of recreational fishing can provide a critical layer in coastal and marine spatial planning.
A new study led by Ball State University and The Nature Conservancy explores new methods for quantifying and valuing recreational fishing, focusing on user-generated content from fishers and key market suppliers.
A key data source for this work was one of the world’s biggest recreational fisher apps. Such apps are used by fishers to help them to choose fishing destinations, provide a sort of journal of their catches, and probably also give them a sort of bragging tool. They have parallels with eBird and iNaturalist – search stuff, identify stuff and log stuff. With colleagues in Ball State University, we worked with over ten years of catch records which we shaved down to look at marine and brackish species caught in coastal and offshore waters:
- Over a million catches,
- Of over 2000 species,
- By a quarter of a million fishers,
- Recorded from 184 countries and territories
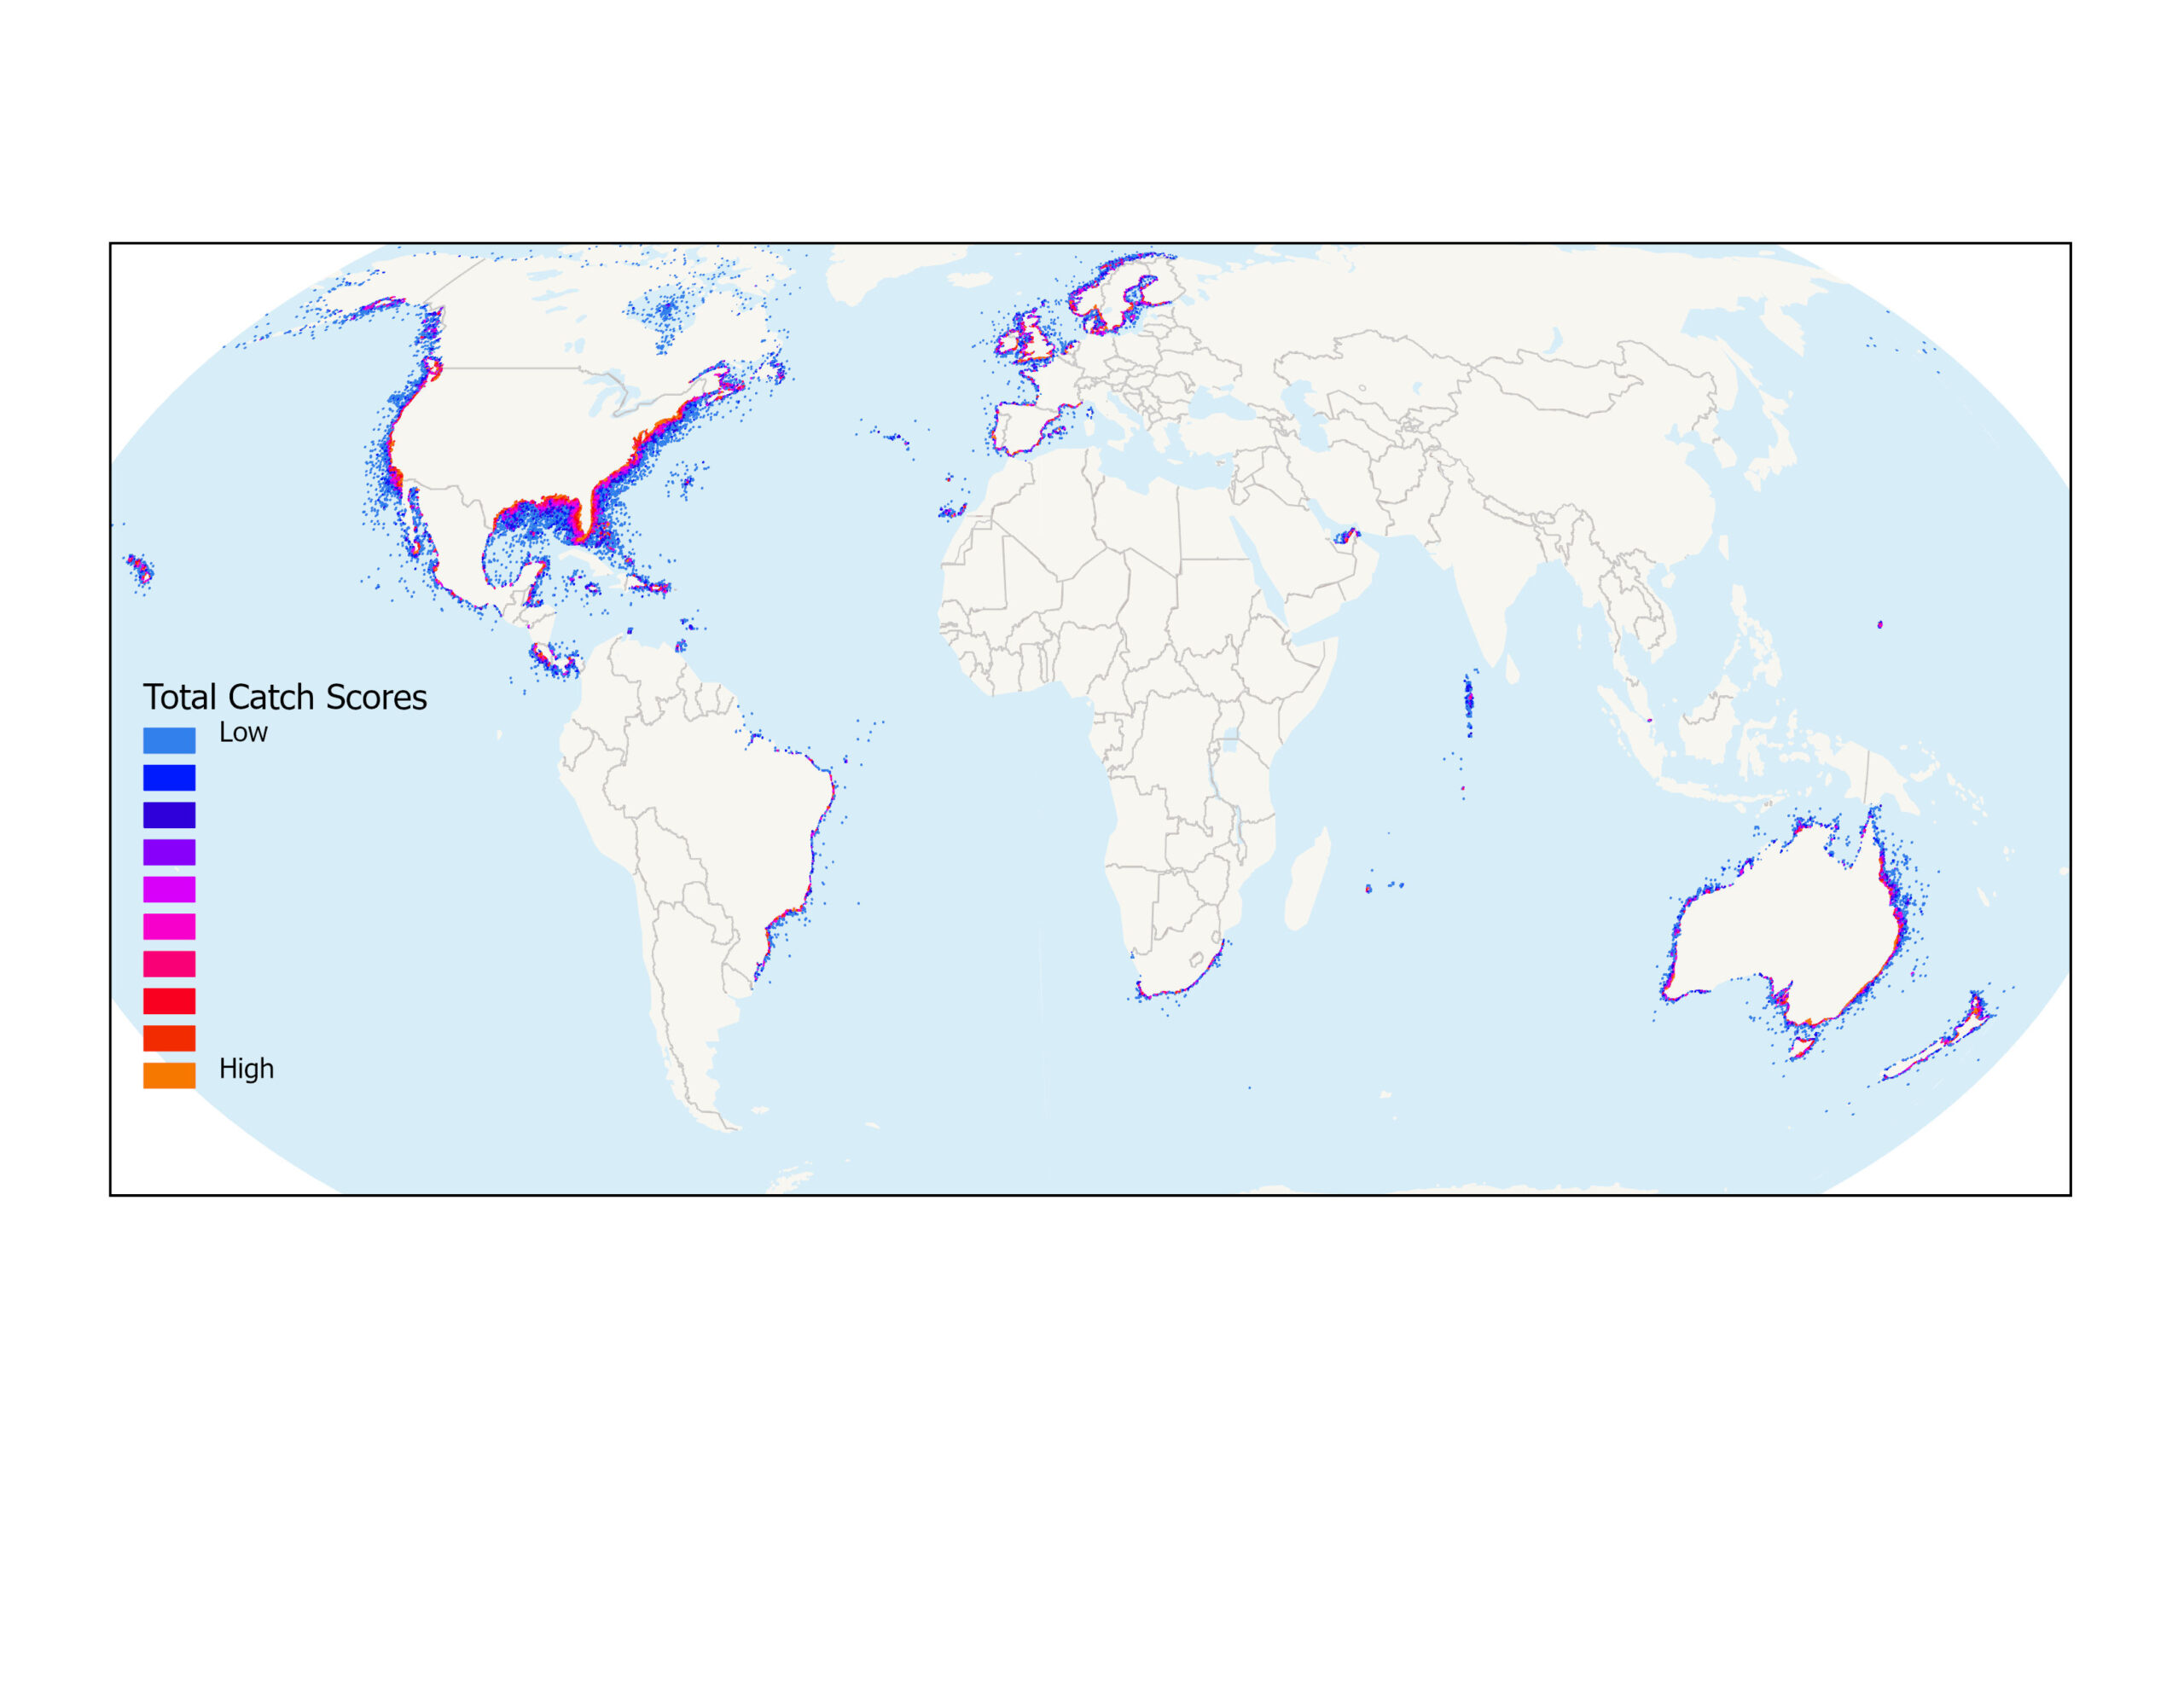
The app was a fabulous resource, and while the coverage wasn’t good enough globally, it gave us maps for many of the big recreational fishing nations, including the USA, Australia and a few European countries. The hotspots won’t be a surprise to many fishers – alongside many more heavily populated coastal areas there are the famous fishing locations such as the big sport-fishing destinations in Mexico and Costa Rica. Most, but not all, recreational fishing remains nearshore and rarely goes far into the more remotely populated regions.
This work has shown the considerable potential for developing accurate maps of recreational fishing, and by combining such work with other user-generated content or big data sources we believe this sort of work could be scaled up, generating critical information for use in marine planning and governance. In this way it could help governments and private sector players assess the spatial importance of recreational fishing and ensure sustainable management. See the report here. Maps are also available on maps.oceanwealth.org.