People depend on coastal and ocean ecosystems like coral reefs, wetlands, and beaches to provide a wide array of services that are needed for their livelihood and well-being. Mapping and communicating these services to a range of audiences are an important goal of the Mapping Ocean Wealth project.

Purpose: Since ecosystems provide services at different spatial scales and are often estimated through the use of complex models, the purpose of the Mapping Ocean Wealth tool is to visualize and simplify global, regional, and local ecosystem benefits for use in natural resource planning and policy decisions. It is intended to provide a critical mechanism to understand and explore specific ecosystem services such as fishery production, carbon sequestration, natural coastal protection, and recreation and tourism. We encourage the use of this tool to support decisions that include nature when trying to ascertain optimal management approaches to maximize societal benefits.
What is it? The Ocean Wealth online mapping tool, or mapping portal, contains a robust data-viewing framework with interactive web apps designed to visualize ecosystem services (i.e. the value of coral reefs based on tourism dollars generated by visitors) represented by important coastal habitats or modeling scenarios. These ecosystem service web apps can be accessed by the open source community, readily adopted by partners, used on mobile devices and further customized to support ocean planning, nature-based adaptation or mitigation solutions.
What Data is accessible? The tool contains social and economic data alongside ecological features allowing policy analysts, decision makers, conservation practitioners, scientists, business managers, coastal planners, and investors to connect these values with specific places.
Global Mapping
Global-scale mapping is the foundation of the Mapping Ocean Wealth tool. While world atlases on coastal ecosystems may provide a baseline of possible ecosystem service valuation, the Mapping Ocean Wealth tool uses detailed analyses to communicate its spatial variability.

Figure 1. shows the global distribution of benefits that humans derive from fish production in mangrove habitats. The model used to derive these data considered mangrove area, freshwater input, nutrient input, mangrove biomass, human population per unit area of mangrove, and whether there was a fish market within 50 km. Existing studies highlight and quantify values that mangrove forest provide, but often fail to illustrate how the spatial distribution of these values might vary. The Mapping Ocean Wealth tool addresses this gap by broadly mapping coastal ecosystem values, highlighting their service attributes from a global perspective.
Regional and Local Mapping
Regionally, the mapping tool focuses in five specific areas — Lesser Sunda Ecoregion of Micronesia, the Gulf of California, the Caribbean, and the Atlantic Coast — summarizing information across and within regions as well as providing the ability to bundle ecosystem services.

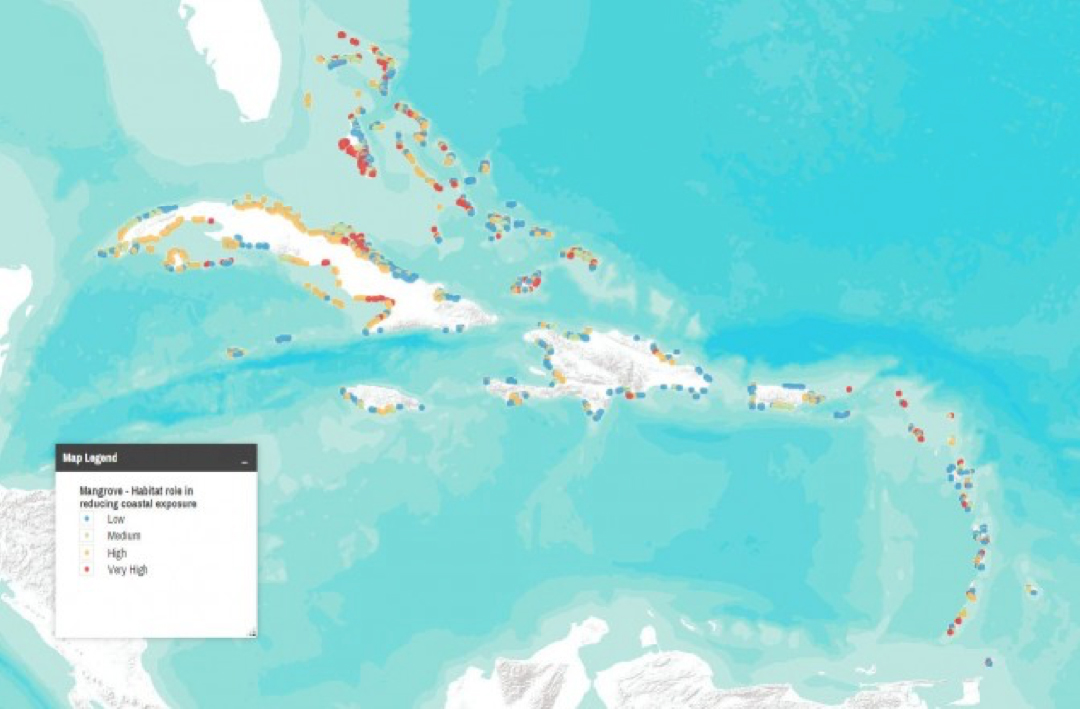
Figure 2. shows the relative roll that mangroves play in reducing coastal exposure to human populations in the Caribbean region. The index was created using the InVEST Coastal Vulnerability model that produces a qualitative estimate of relatively high or low exposure to erosion and inundation during storms. By coupling these results with global population information, the model can show areas along a given coastline where humans are most vulnerable to storm waves and surge. Once vulnerable portions of the coastline have been identified, the Coastal Protection Model is used to evaluate the protective benefit of natural coastal protection assets. This information can help coastal managers, planners, landowners, and other stakeholders identify regions of greater risk to coastal hazards, which, can in turn, better inform development strategies and permitting.
Local-scale mapping
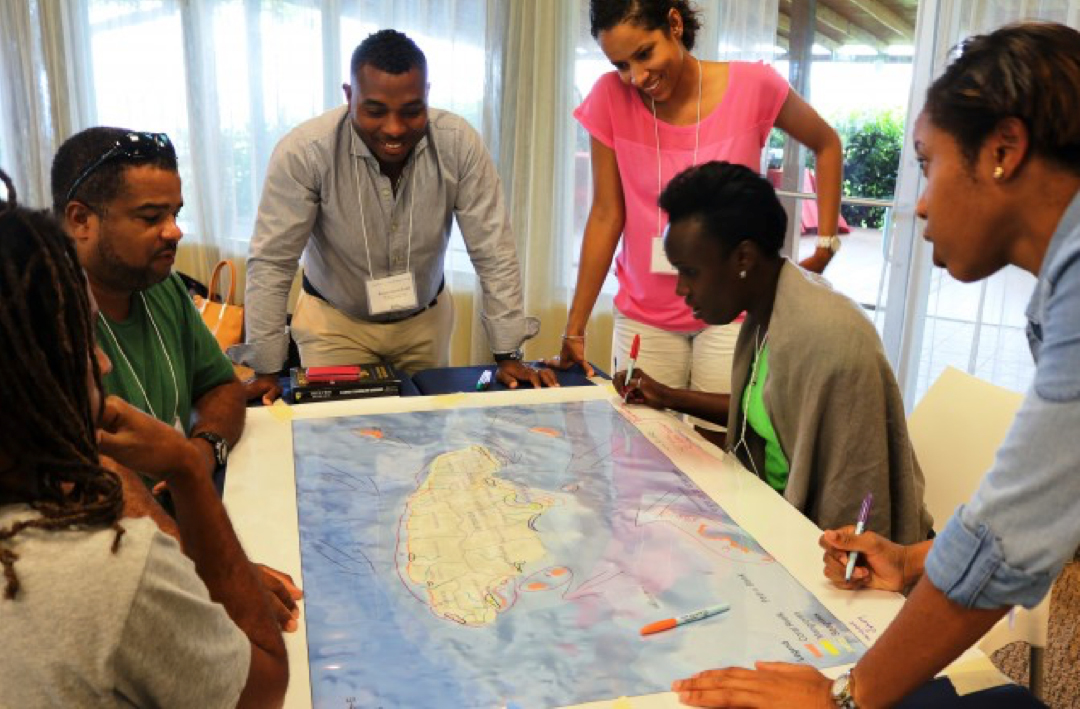
Decisions about where activities such as settlement, infrastructure development, coastal engineering or fishing take place are often dimes driven by policy and funding decisions made at large scales. For these decisions global or regional maps are often insufficient. Local scale understanding of ecosystem service delivery and value is a critical need for influencing these planning processes.
Mapping ecosystem services at local scales requires very detailed understanding and modeling around ecological, social and economic variables. Mapping Ocean Wealth examines the value of natural coastal habitats such as oyster reefs, coral reefs, tidal marshes, mangroves, beach dunes and seagrass using various quantitative models such as Natural Capital Project’s Marine Integrated Valuation of Environmental Services and Tradeoffs (InVEST). The model calculates the potential of natural coastal habitats to reduce wave height and wave energy, thereby lowering the risk of inundation and erosion in coastal areas.
For more on Mapping Ocean Wealth at the local scale visit Project Areas or Contact Us.
Tool Development & Approach
The approach: The Mapping Ocean Wealth tool implements a three-stage process to understand, model, and map ecosystem-services:
Review and assemble the data from field studies and existing reviews. While it is assumed that ecosystem services are not enumerated in most areas, the sum total of ecosystem services studies from other locations is often very large and commonalities are sufficient for the transfer of such values.
Utilize or build the best possible model of the drivers of ecosystem value. If existing ecosystem service estimation models are identified in the review process, expert review is required to “ground truth” or calibrate the models. Where models are absent or lacking, the feasibility of developing original numerical models where ecosystem service delivery can be expressed is evaluated.
Develop maps to represent key drivers at various spatial scales. At broad scales, summary maps showing single ecosystem service delivery are valuable, but are enhanced where multiple ecosystem services are acting together. To support management on the ground, we calibrate maps and trade-off scenarios by incorporating information based on finer resolution data and local knowledge.
Development: The Mapping Ocean Wealth tool has been designed after Coastal Resilience, another map-based decision support tool that provides local, state and national planners a step-wise process to guide decisions to reduce the ecological and socio-economic risks of coastal hazards. Both tools use the same open source platform that is available under a GNU General Public License, version 3 license agreement. A team of partners from The Nature Conservancy, CISR at the University of California, Santa Cruz, the University of Southern Mississippi (USM), Azavea, and the U.S. Geological Survey work together to contribute to the development of the full suite of browser-based apps across the Ocean Wealth and Coastal Resilience mapping tools.

